Safety Insights
The default tab shows the machine’s safety record — incursions, acknowledgement rates, and geographic data.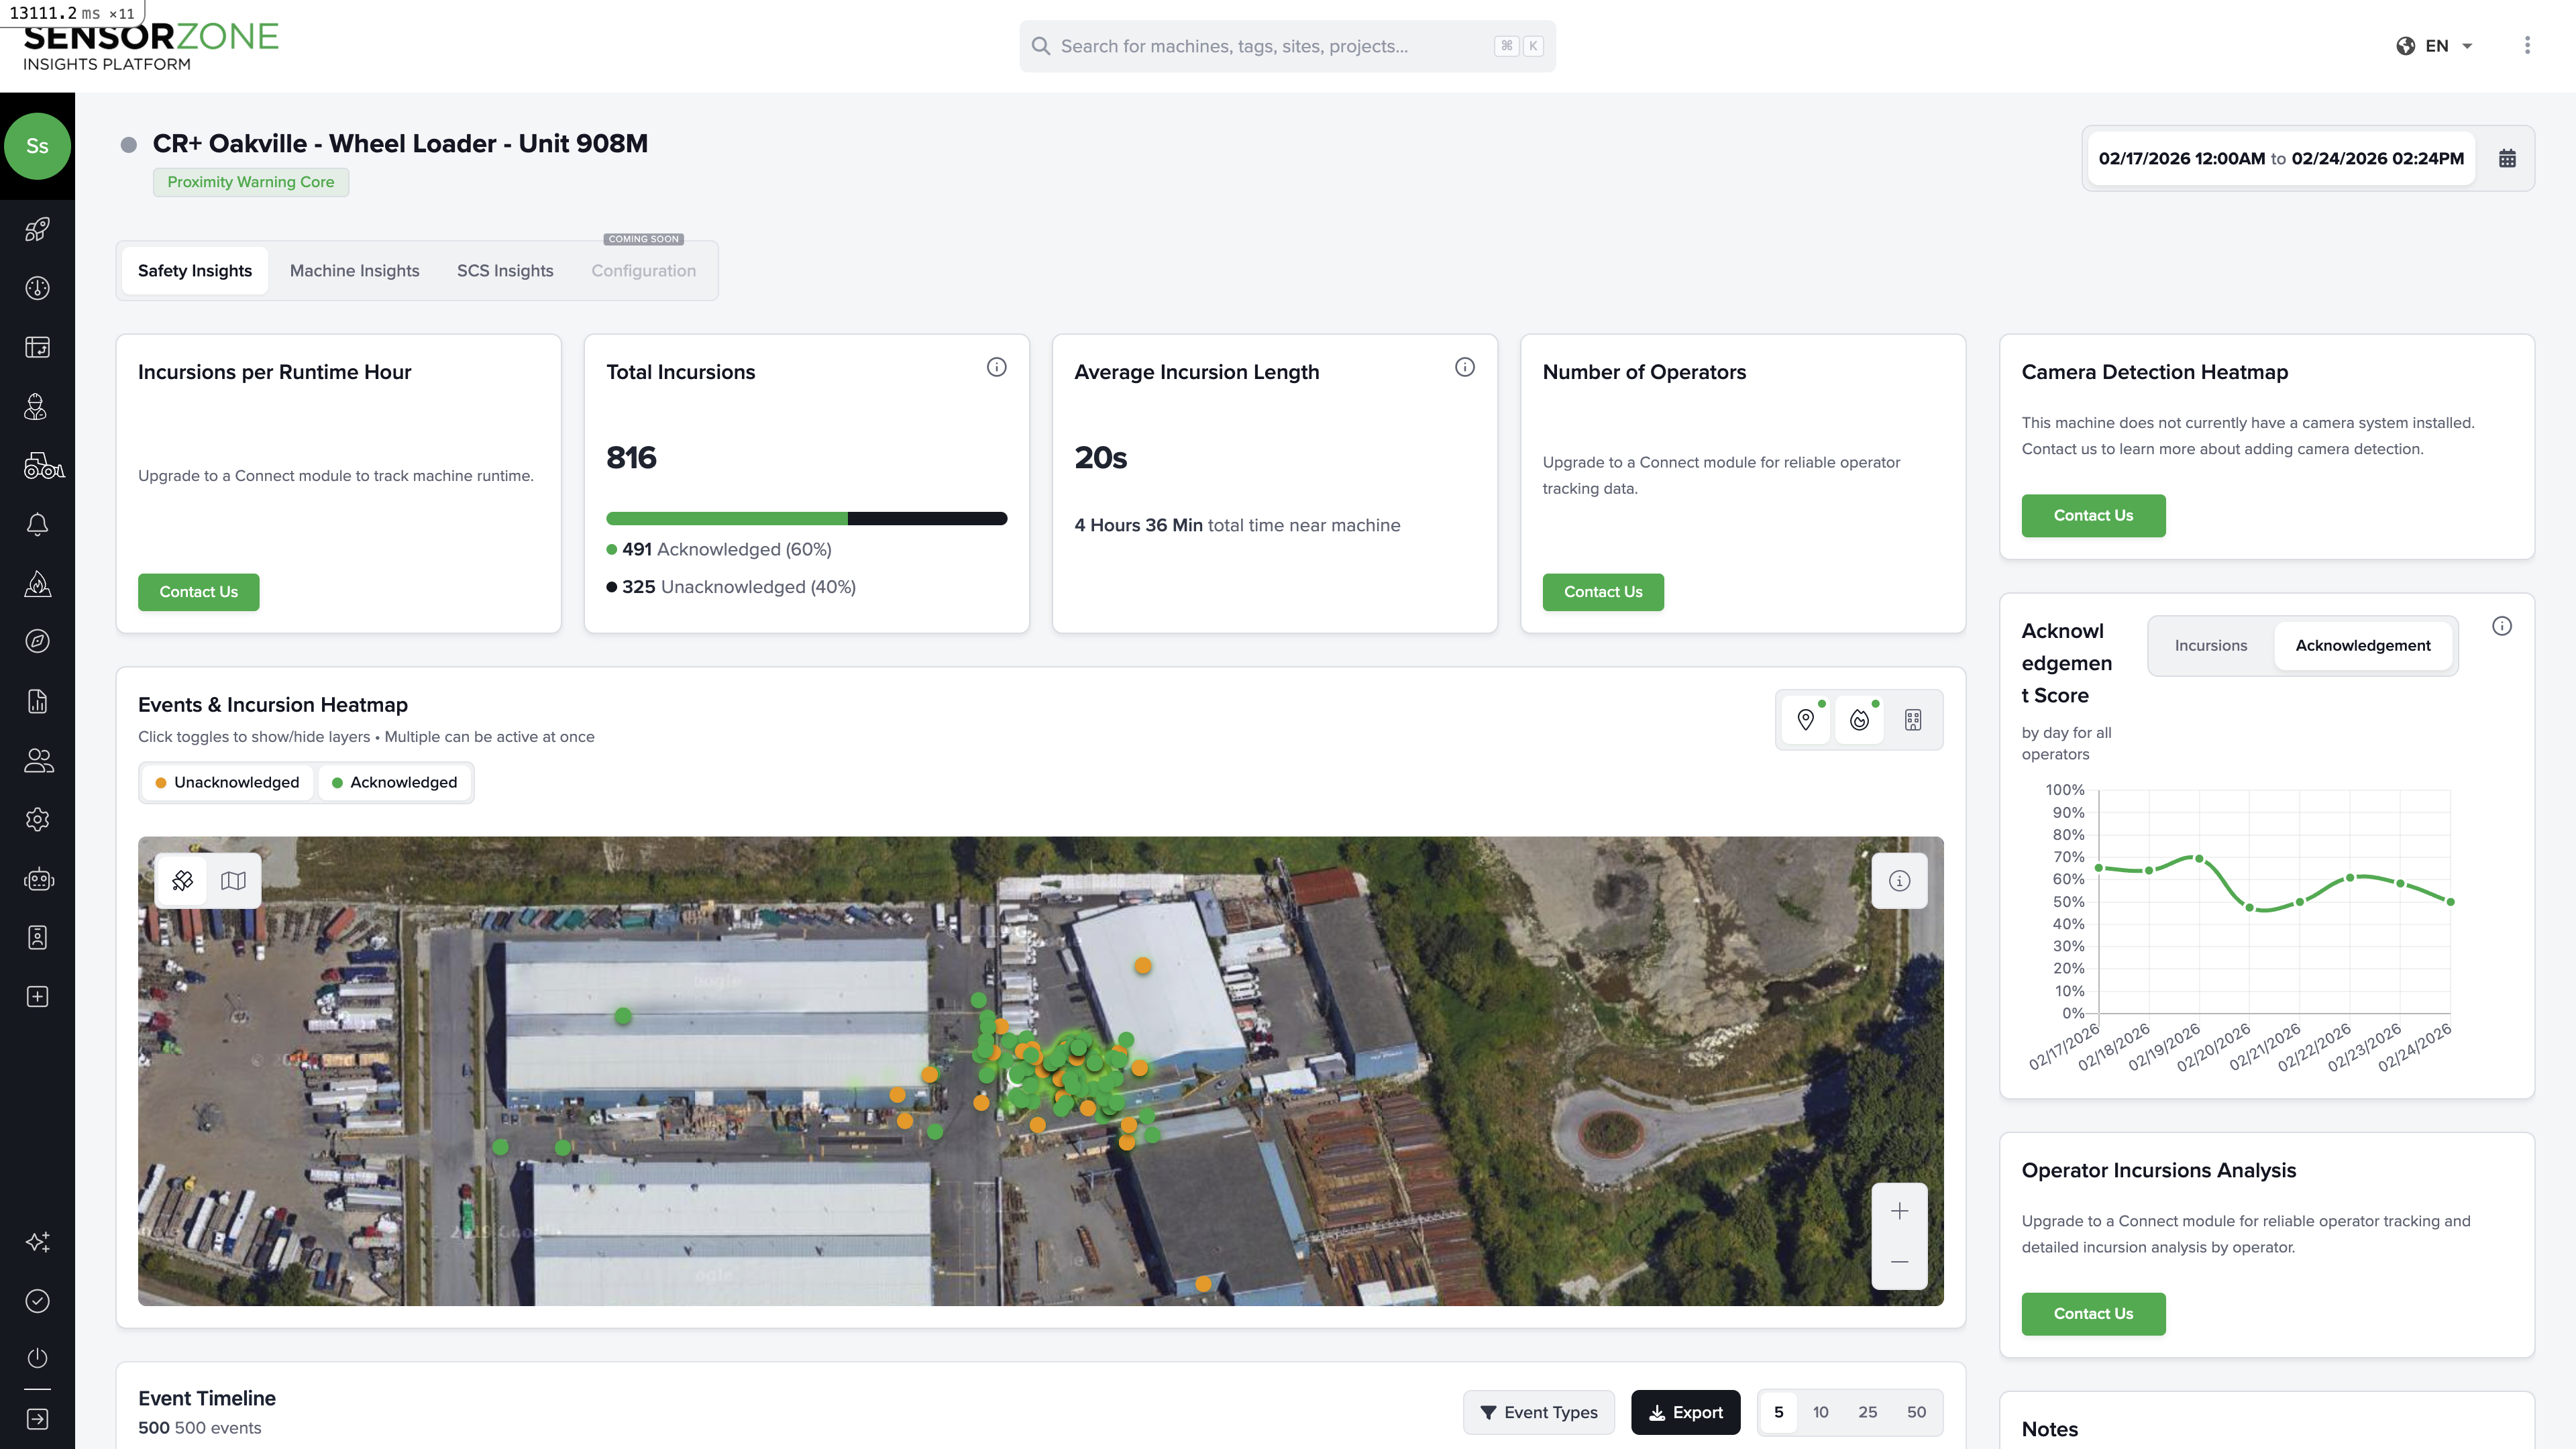
Safety KPI cards
| Metric | What it tells you |
|---|---|
| Incursions per Runtime Hour | Normalized safety rate accounting for how much the machine was running |
| Total Incursions | Total proximity events, split into acknowledged and unacknowledged |
| Average Incursion Length | How long pedestrians typically remain in the detection zone |
| Total Time Near Machine | Cumulative time pedestrians spent in proximity |
| Number of Operators | How many different people operated this machine in the period |
Events and incursion heatmap
A satellite map showing exactly where incursion events occurred around this machine. Each marker represents an event:- Green — Acknowledged by the operator
- Orange/Red — Unacknowledged
Acknowledgement score chart
A daily chart showing the machine’s acknowledgement rate over time. Look for:- Consistently high scores — Operators are engaged and responsive
- Drops — May correlate with new operators, shift changes, or equipment issues
- Zero days — Could mean the machine was inactive or the operator didn’t acknowledge any warnings
Operator incursions analysis
A table listing each operator who ran this machine, showing their individual incursion counts and acknowledgement rates. This helps identify whether safety performance varies by operator.Event timeline
A detailed log of every event — incursions, alarms, GPS tracks, device logs, and video requests — with timestamps and status. Filter by event type to focus on what matters.Machine Insights
Switch to the Machine Insights tab for operational data about the machine’s usage and connectivity.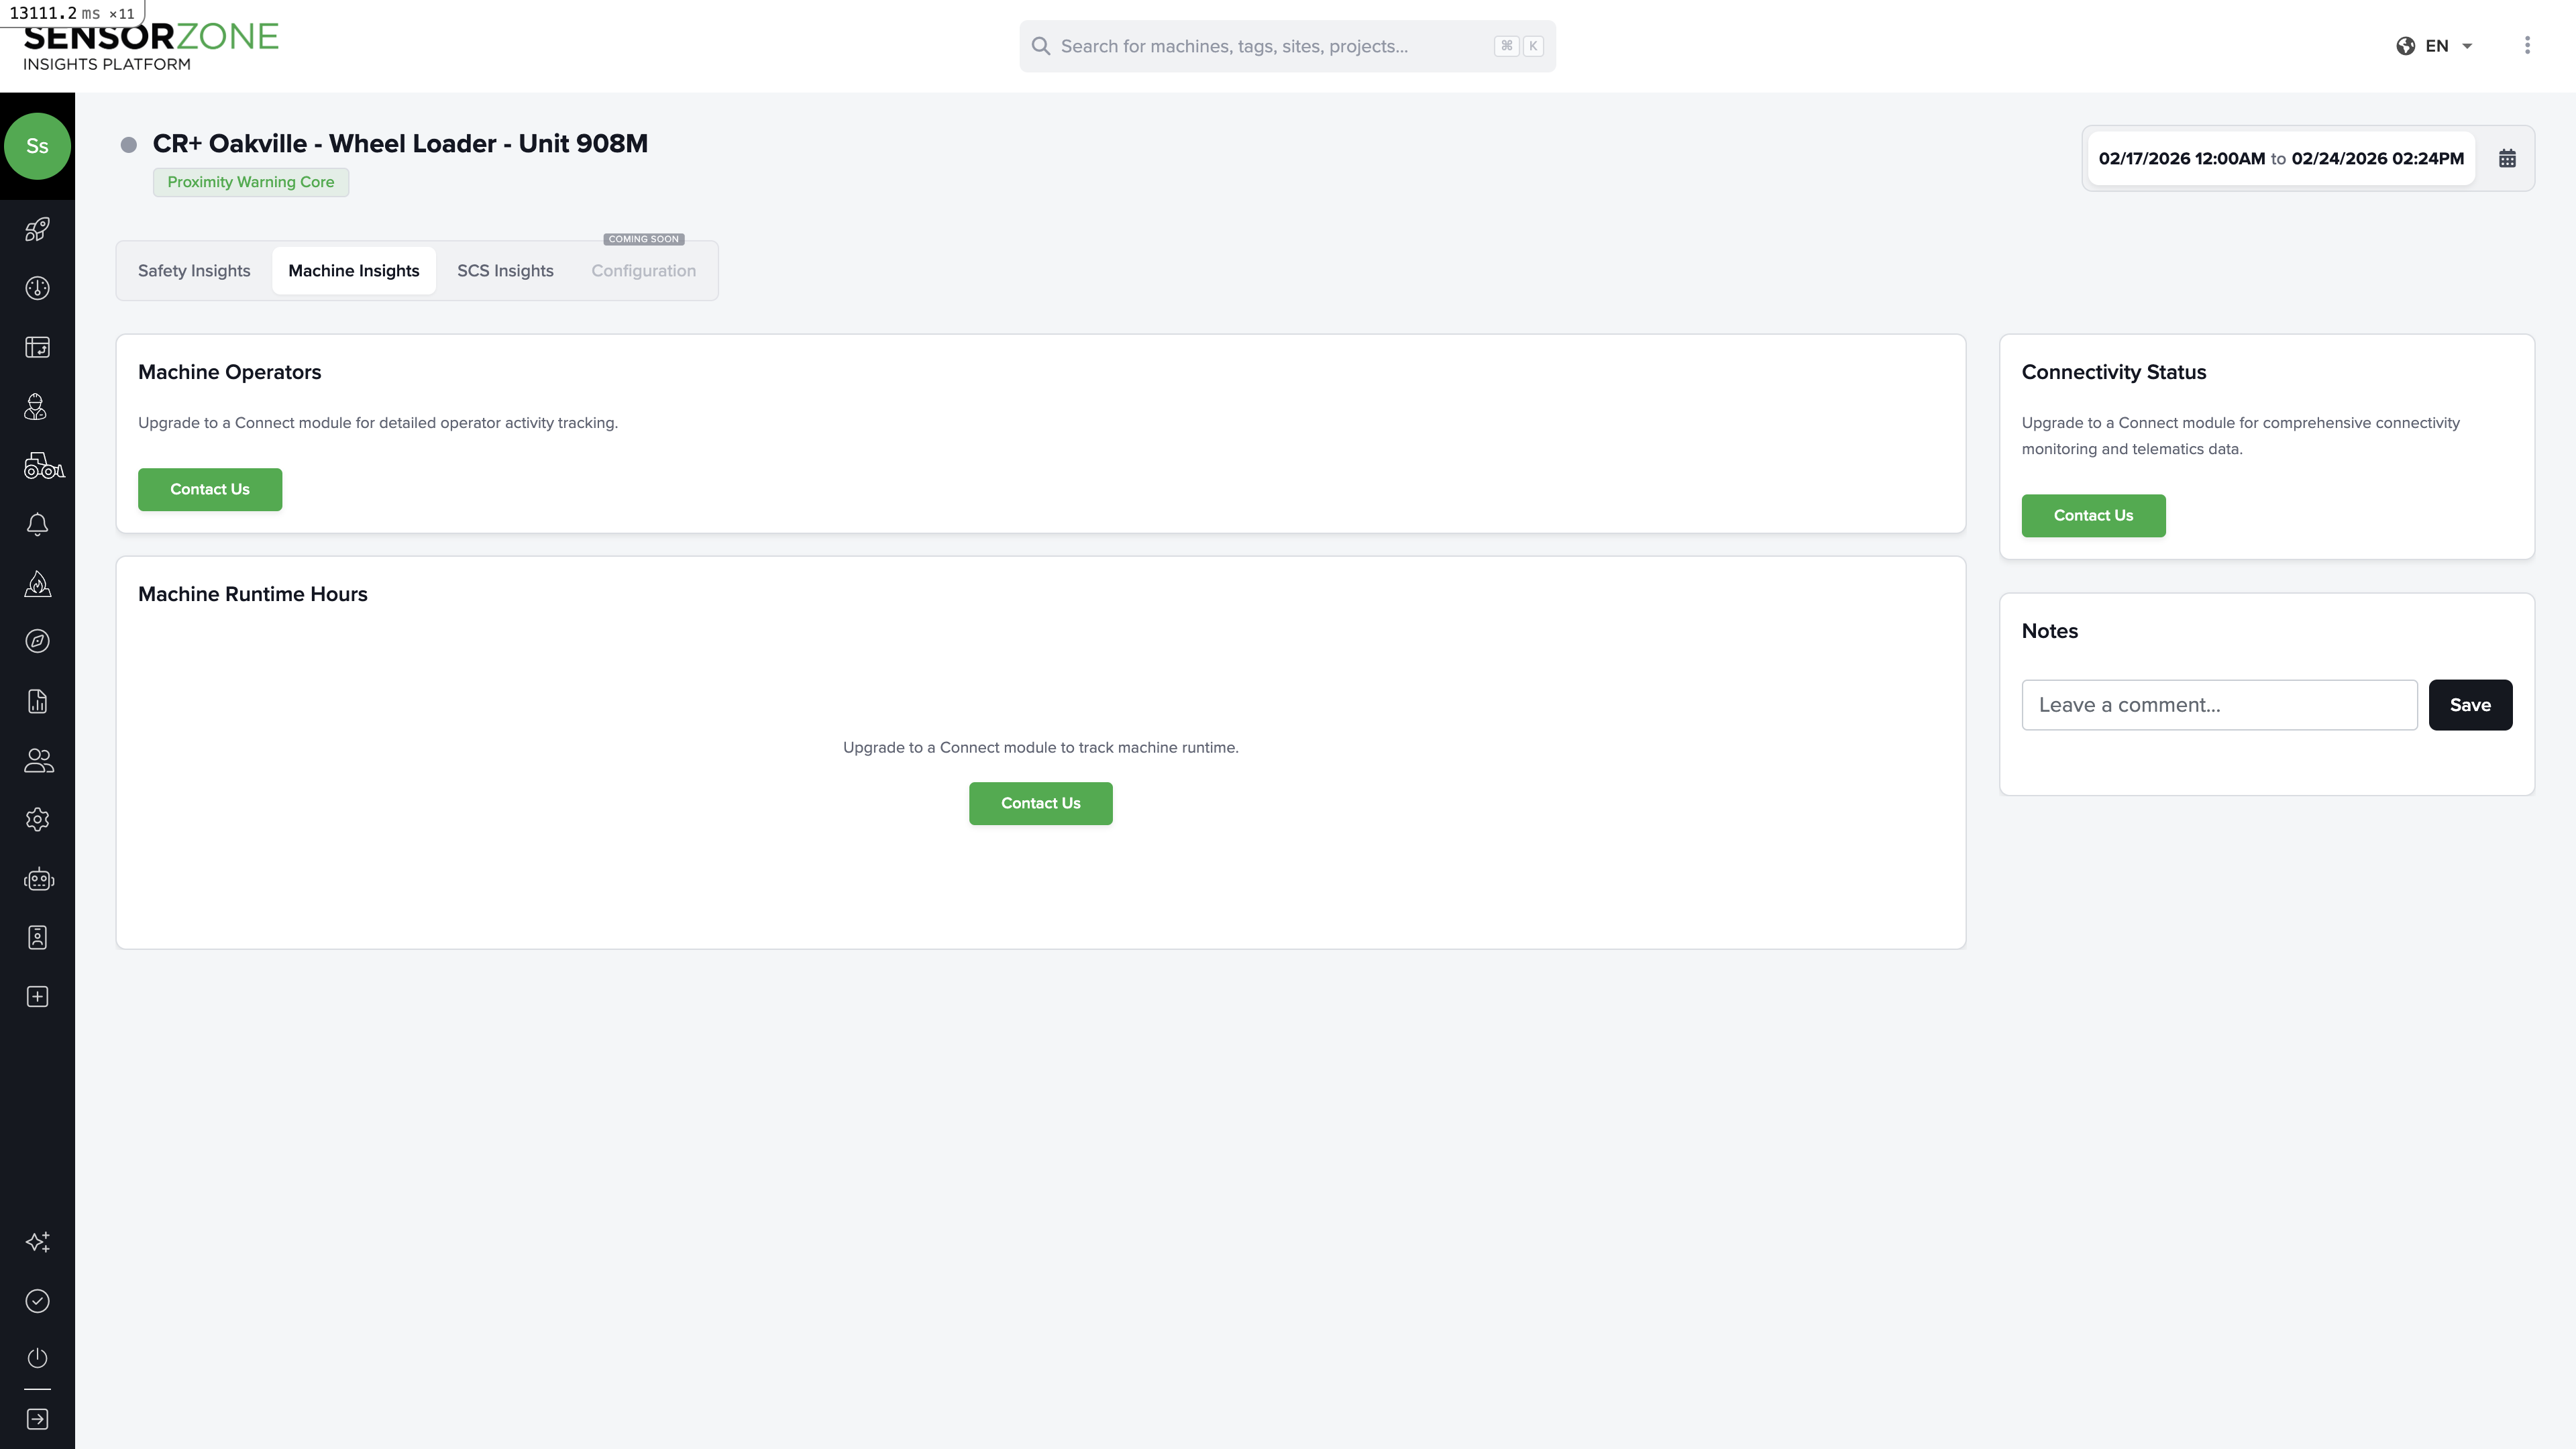
Machine operators
Shows which operators used this machine and for how long. The runtime is displayed as a Gantt-style chart by day and operator, making it easy to see shift patterns and handovers.Machine runtime hours
A daily breakdown of total runtime (ignition on) for the machine. Useful for:- Tracking utilization rates
- Correlating runtime with incursion patterns
- Identifying idle periods
Connectivity status
Shows the real-time status of the machine’s connected systems:- Battery level — Current charge state
- Online status — Whether the base station is currently communicating
- Connect module — Status of the Trackunit/telematics module (if installed)
Some features on the Machine Insights tab require a Connect module to be installed on the base station. If you see “Upgrade” prompts, contact your administrator about enabling telematics integration.
Video
If the machine has cameras installed (Vision 360 system), a Video tab appears. See the Video guide for details on:- Requesting historical clips by timestamp and duration
- Viewing live streams
- Browsing previously requested clips
- Camera heatmaps showing detection zones
SCS Insights
The SCS Insights tab displays safety-critical system data when available. This includes technical readings from the machine’s safety systems.Notes
All tabs share a Notes section in the sidebar. Document maintenance records, incident observations, or configuration changes for this machine.Next steps
Machines
Return to the Machines list overview.
Person Detail
Explore a person’s safety record.